Island Lab · Pollica · Cilento Coast
A living sea, made legible, one meadow at a time.
How we are approaching Posidonia stewardship in Pollica: the strategy, the science, and the tools that let a community see the water the way the meadow actually experiences it.
01
How we are looking at this
Most decisions about the sea run on borrowed numbers.
The data behind those decisions is real. It is just not about your site.
A meadow's fate gets decided on a regional model that describes a wide area, or a survey taken on a different day in a different year, miles from the water that matters. A nearshore bay can run several degrees off the regional average. Decisions are made on the gap between the two, and most of the time no one ever sees the gap.
Why so far off? Because the regional model's smallest unit is a grid cell kilometres wide, and everything that makes your cove yours happens below that scale: the shape of the seabed, the freshwater pushing out of a river mouth, the way a single day of sun and slack wind layers warm water over cold. The model averages all of it away. Oceanographers call these sub-grid processes; for a meadow, they are the whole story.
Pollica's question is simple to state and hard to answer: are the Posidonia meadows healthy, and how does the community keep them that way, with knowledge it can see, trust, and steward for itself, rather than depending on distant agencies or accepting decline as invisible and inevitable.
We are the truth layer: continuous, site-specific measurement at the meadow, honest about its own uncertainty. It is the ground truth every satellite, carbon, and policy model is missing.
One discipline shapes everything that follows. A Posidonia meadow can be thousands of years old and grows only a few centimetres a year; once lost, it cannot be quickly replanted. So this is a protection tool, not a restoration tool, and protection starts with being able to see stress before it becomes loss.
02
The core idea
Three truths about any point on the map.
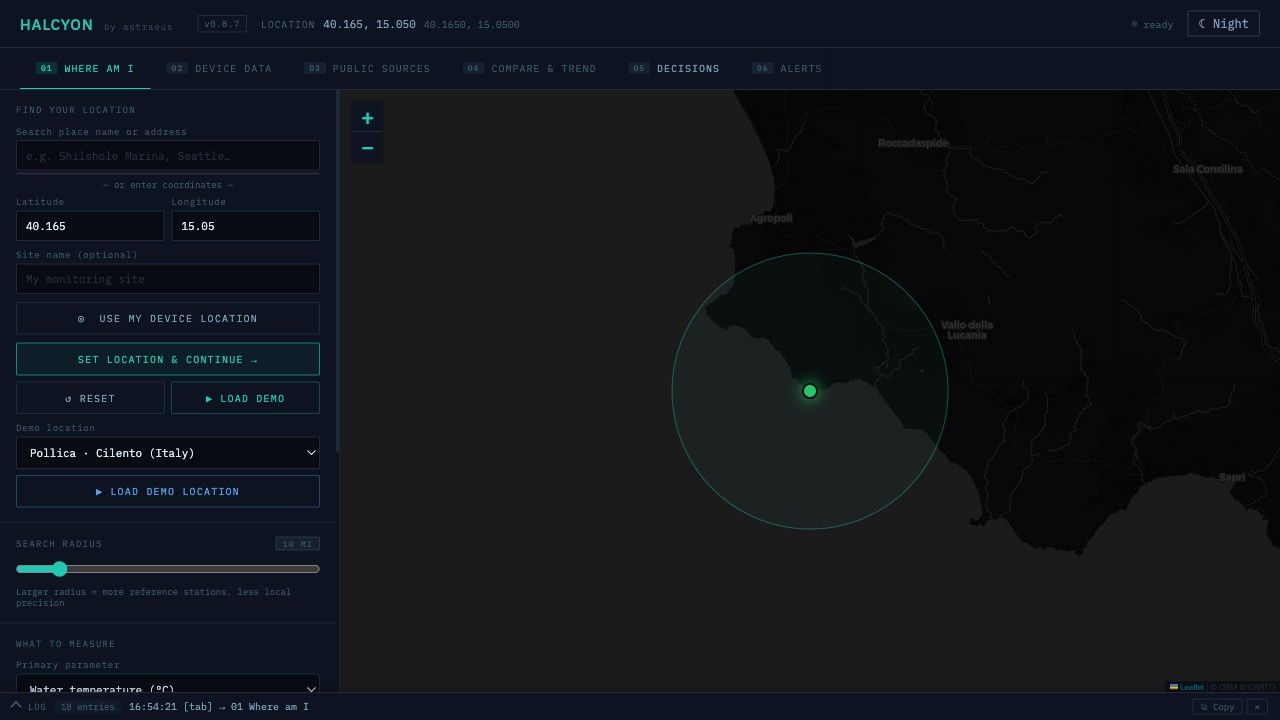
Everything we build is a way of reconciling three different claims about what the water is doing at a given place and moment. Slide between them.
The global modelThe local sensorThe reconciled signal
slide across to explore
The reconciled signal is the product. It takes the model as a base trajectory and bends it toward what the sensors actually measured, with confidence that is strong right at each instrument and fades with distance and time. Near a sensor you are reading the water. Far from one, you are reading a well-informed guess, and the system tells you which is which.
That continuously corrected, site-specific layer is what we call a digital twin of the water, a working model of this exact place that stays in step with it as conditions change, instead of a regional average that never quite fit.
03
The organism at the centre
Posidonia oceanica: the lungs of the Mediterranean.
Posidonia is a seagrass: a true flowering plant, not an alga, living fully submerged. It is endemic to the Mediterranean, found nowhere else on Earth, and forms vast meadows from the shallows down to thirty or forty metres wherever the water is clear enough for light to reach. Some meadows are thousands of years old and spread only one to six centimetres a year.
It earns the nickname. A healthy meadow releases on the order of 14–20 litres of oxygen per square metre per day1, shelters the nurseries of much of the basin's marine life, and its leaf-banks dampen waves and hold the coastline in place. And it is one of the densest carbon stores on the planet: on the order of 700 tonnes of organic carbon per hectare buried in the seabed matte, some of it laid down over thousands of years2. That buried, long-lived store is what people mean by blue carbon.
It is also in decline, roughly a third of the Mediterranean's meadows lost in the past fifty years3, and it is fragile in a specific way: it is slow. Because a lost meadow cannot be rebuilt on any human timescale, protecting an intact one is vastly cheaper and more certain than trying to restore it. What threatens it is well understood: marine heat (thermal stress and rising shoot mortality set in above ~28 °C4), poor water quality, loss of light from turbidity and sediment, and physical damage from anchoring. Every one of those leaves a signature you can measure, if you are measuring at the meadow.
- Oxygen output of 14–20 L O₂·m⁻²·d⁻¹: IMEDEA / BBVA Foundation, via MedWet, “Posidonia, the lung of the Mediterranean.”
- Matte carbon stock ≈711 Mg C·ha⁻¹, accumulated over millennia (radiocarbon-dated): Monnier et al. (2022), “The Posidonia oceanica matte: a unique coastal carbon sink,” Calvi Bay, Corsica.
- ≈34% loss over the past 50 years: Telesca et al. (2015), “Seagrass meadows (Posidonia oceanica) distribution and trajectories of change,” Scientific Reports.
- Thermal stress and shoot mortality above ~28 °C: Marbà & Duarte (2010), “Mediterranean warming triggers seagrass (Posidonia oceanica) shoot mortality,” Global Change Biology.
04
From water to plant
We model the plant, not just the water.
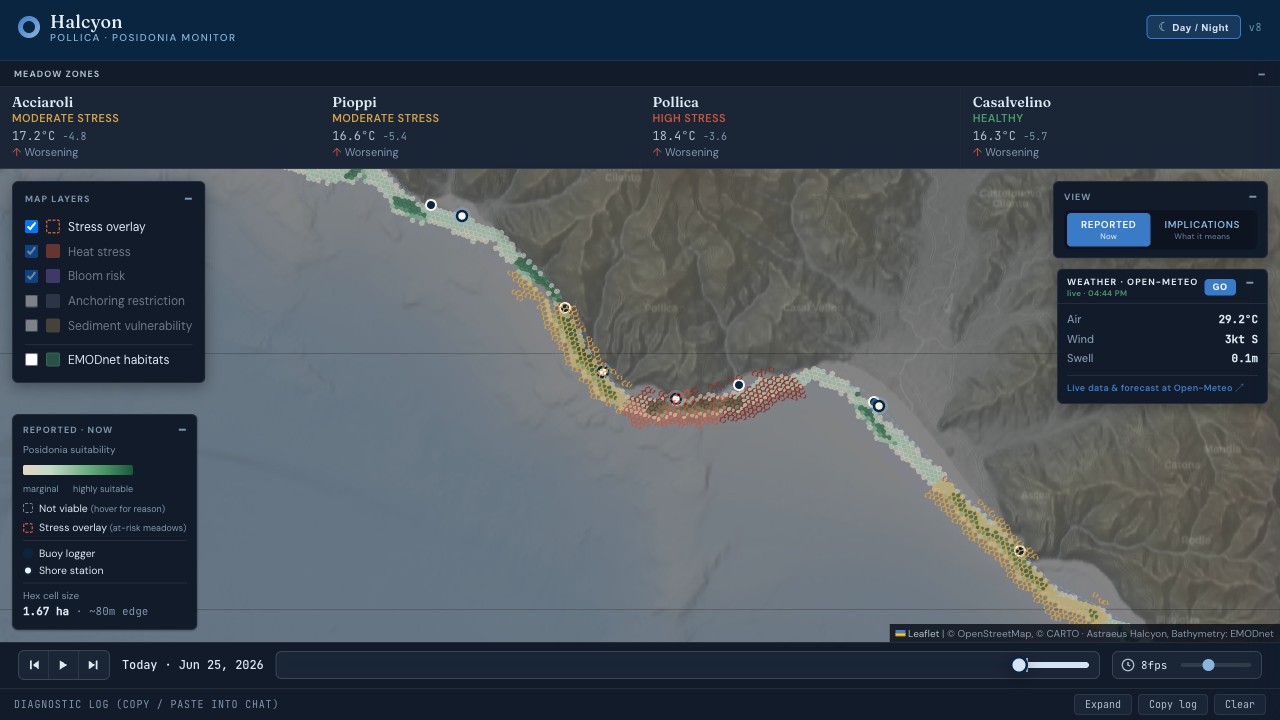
Knowing the temperature and the light at the meadow is only half the work. The other half is knowing what they mean to the plant. So on top of the water twin sits a second one: a living model of the meadow itself, built from how Posidonia is actually known to respond to heat, light, and water quality.
It is mechanistic, not a line fitted to past data. It carries a real carbon balance, what the meadow earns from photosynthesis set against what it spends just staying alive, and a reserve: the carbohydrate battery a meadow lives off when conditions turn against it. Every day it returns the meadow's condition, the single stressor doing the most damage, and a short forecast of where it is heading.
Two very different things kill a meadow, and the model tells them apart. Heat kills by mortality, above about 28 °C shoots begin to die even while the water stays clear and bright. Darkness kills by starvation, when runoff or sediment dims the water, photosynthesis stops, the battery drains, and the meadow starts to consume itself. One is a fever, the other a famine.
That is the difference between a dashboard and a model. A dashboard tells you a number went up. The model tells you the meadow is three days into a heat fever with its reserves still full, or a week into a light famine with the battery nearly empty, and therefore whether this is a moment to act or a moment to watch.
05
Where the next sensor goes
The twin knows where it is blind.
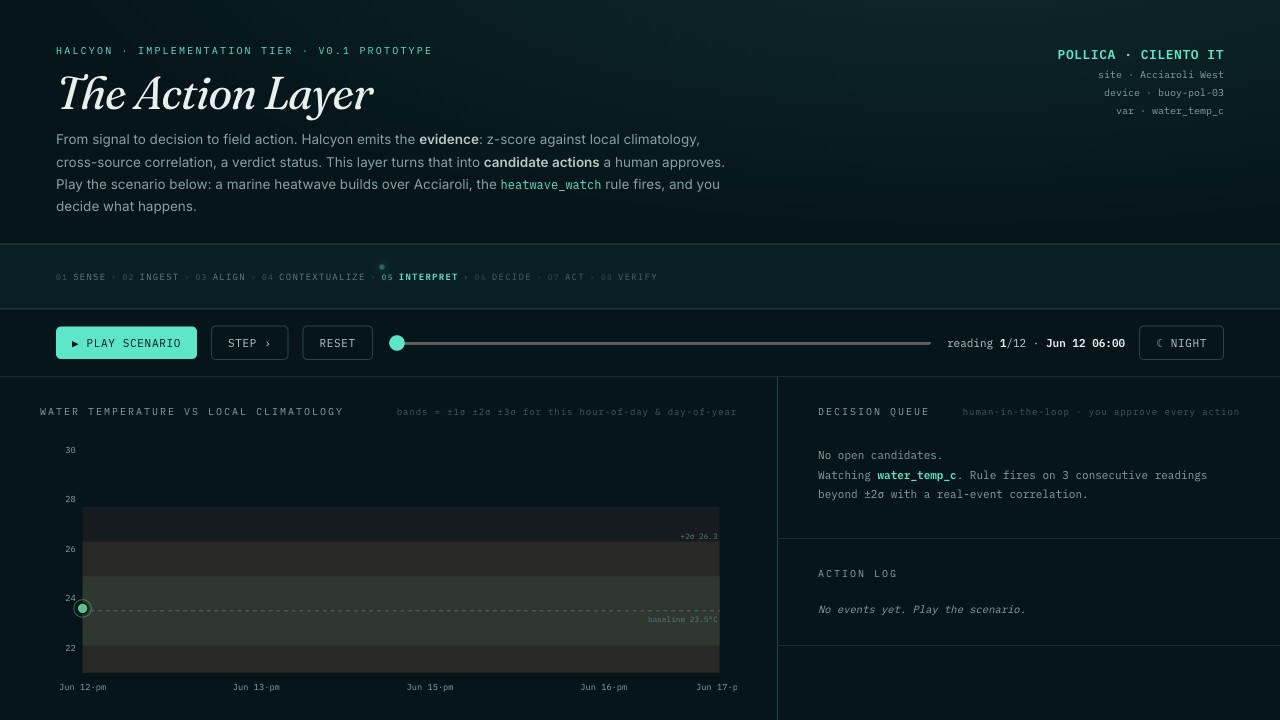
A model built on public data is honest about where it is guessing. Those blind spots, the zones where the twin is least certain and the meadow matters most, are exactly where one real instrument buys the most truth. Drop a sensor there and the whole picture sharpens around it.
This is the oldest move in earth observation, borrowed from how satellites already work together: a broad, cheap, constant sweep finds where something is changing, and that finding cues a scarce, precise instrument to take a closer look. We run the same loop at the scale of a single bay. The free, public-data twin is the sweep. Your sensors are the precise instrument. The twin decides where they earn their keep.
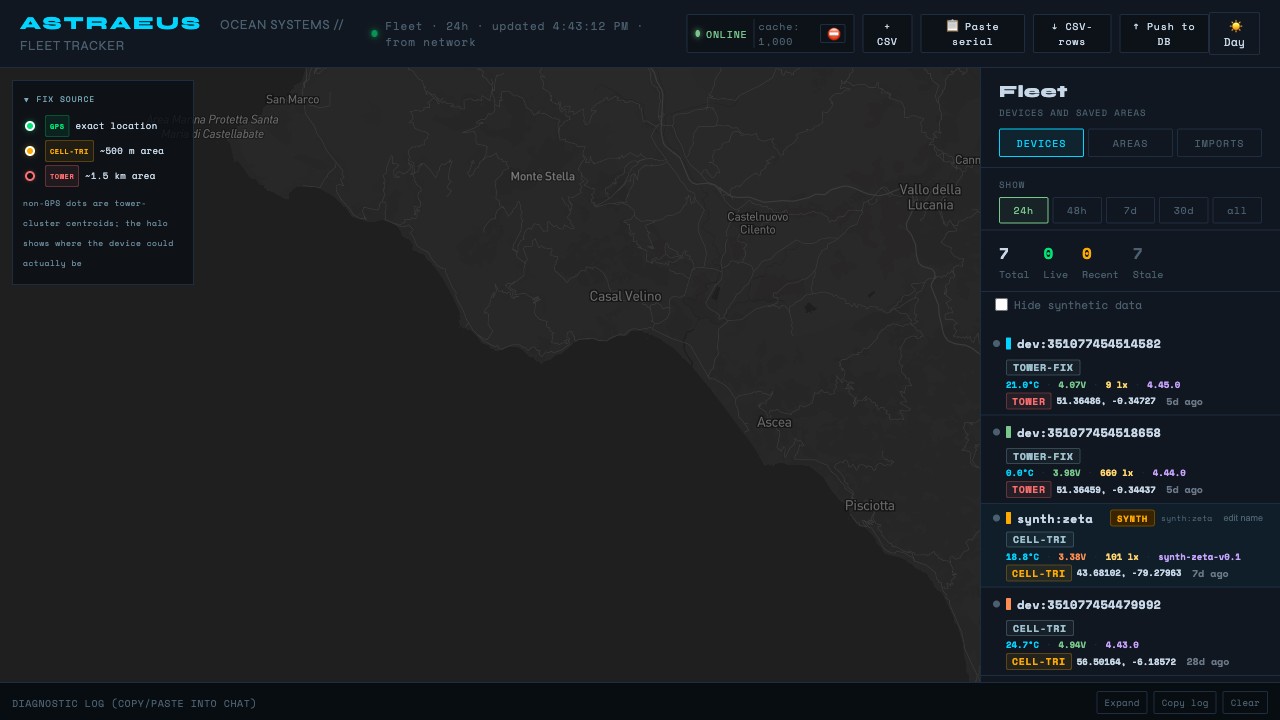
Which means a community never starts from nothing. You begin with the public-data twin, real, useful, and clear about its own limits, at no cost. Each sensor you add buys down the uncertainty where it counts, and the twin grows sharper and more local with you: from low resolution to high, from modeled to measured, at whatever pace a coast can carry.
06
Honesty about the instrument
What we measure, and what we don't.
A small number of well-documented conditions decide whether a meadow grows, holds, or declines. We measure those continuously, at the meadow. That is something neither satellites alone nor periodic sampling do well.
Temperature
The master stressor, with clear biological thresholds. A continuous heat-stress record for the meadow that nobody on this coast currently has.
Light & turbidity
The photosynthesis budget. When the water dims, the meadow starves; we capture that as it happens, not weeks later.
Dissolved oxygen
Whether the meadow is actively breathing. A clear, early signal of stress before it becomes visible loss.
Salinity
The background state, stable in the Mediterranean. Useful for catching freshwater runoff events that shock the plant.
What we provide
The continuous, site-specific environmental truth at the meadow, and how far the regional model is off at this exact place: the input every health, satellite, and carbon model needs to mean anything.
What we don't claim
We don't read chlorophyll, we don't map meadow extent (that's satellite work), and we don't count carbon tonnes. We measure the conditions that drive the growth a carbon method then quantifies. We feed that model; we don't pretend to be it.
07
An evolving pipeline
Every layer says where it comes from.
The system is a pipeline that evolves. Today some layers are live open data (OpenStreetMap, ESA, NOAA, Open-Meteo, EMODnet) and several are honest synthetic stand-ins, generated by Claude, until the feeds and a sensor make them real. Nothing synthetic is hidden: each stand-in is labeled and points at a named real-world source it will become.
Inputs · where it's from
LocationOperator · Comune di Pollica
WeatherOpen-Meteo · ECMWF
BathymetryClaude stand-in → EMODnet (EU)
Ocean physicsClaude stand-in → Copernicus / CMEMS
Light & turbidityClaude stand-in → ESA Sentinel-3
Tides→ NOAA / tide model
In-situIsland Lab buoy → Supabase
→
Applications
ContextCoastal Data Sources · OSM / CARTO
Ecosystem Mapping AgentOSM / CARTO · EMODnet habitats
ModelingIsland Lab Posidonia engine
ActionsReckoning action layer
→
Outputs · local twins
Weather twinIsland Lab downscaler
Ocean twinClaude → calibrated
Biology twinIsland Lab engine + Claude priors
DecisionsClaude demo → live
Local
Open Source Data
Derived
Synthetic · Claude stand-in
Calibrated · target
feeds
reinforces / calibrates (live loop)
Hover any box to trace its links. The dashed green edges are the live loop: the deployed buoy calibrates the three twins, the twins sharpen the model's priors, and decisions return as actions you can measure.
Synthetic stand-in → Open public feed → Calibrated to the site by a deployed sensor
That arc is the whole product. The Project Path below walks it step by step; the Current / Target switch on the dashboard shows the same pipeline flip from synthetic stand-ins to a calibrated local truth layer.